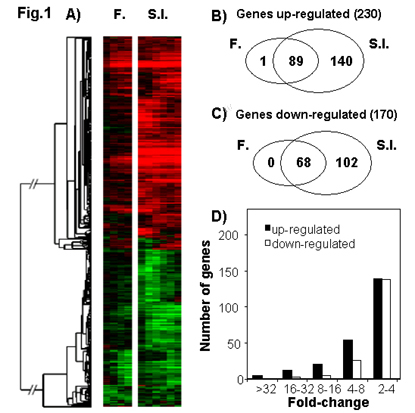
Figure 1
A) Cluster image of the 400 DIRGs. The expression profiles after fungal natural infection (F.) and septic injury (S.I.) are shown. Columns correspond to different time points and rows to different genes. Red indicated increased mRNA levels while green indicated decreased levels compared to uninfected flies. The brightest reds and greens are six fold induced and repressed respectively. The graphs in B and C show the number of the genes induced (B) and repressed (C) responding to fungal natural infection (F.), septic injury (S.I.) or both. D) Distribution of induced (white bars) and repressed (black bars) genes based on their fold-change.